4DTL
Datalytics
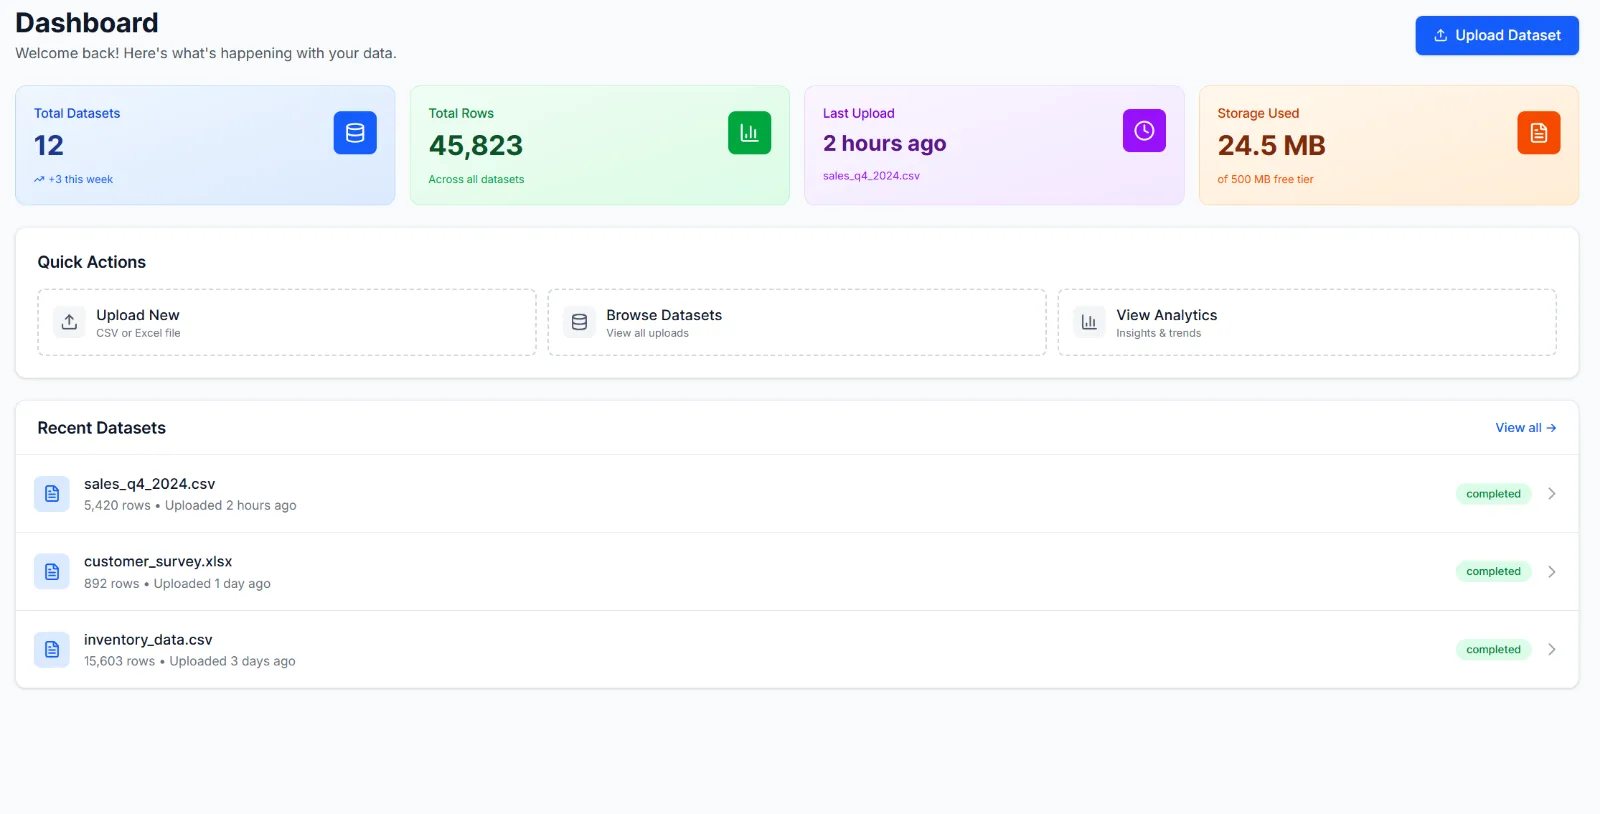
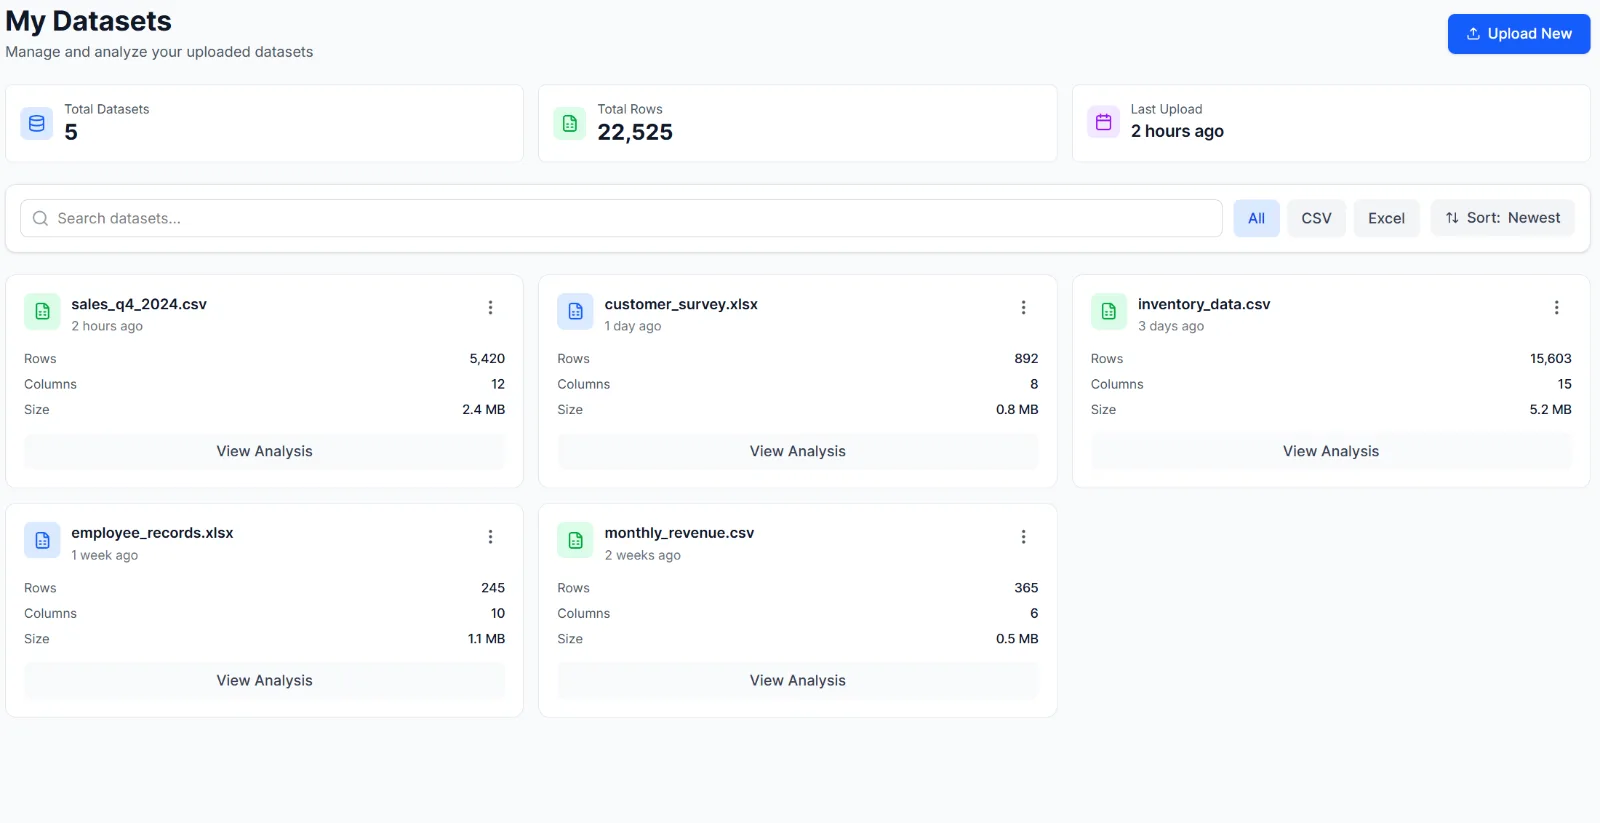
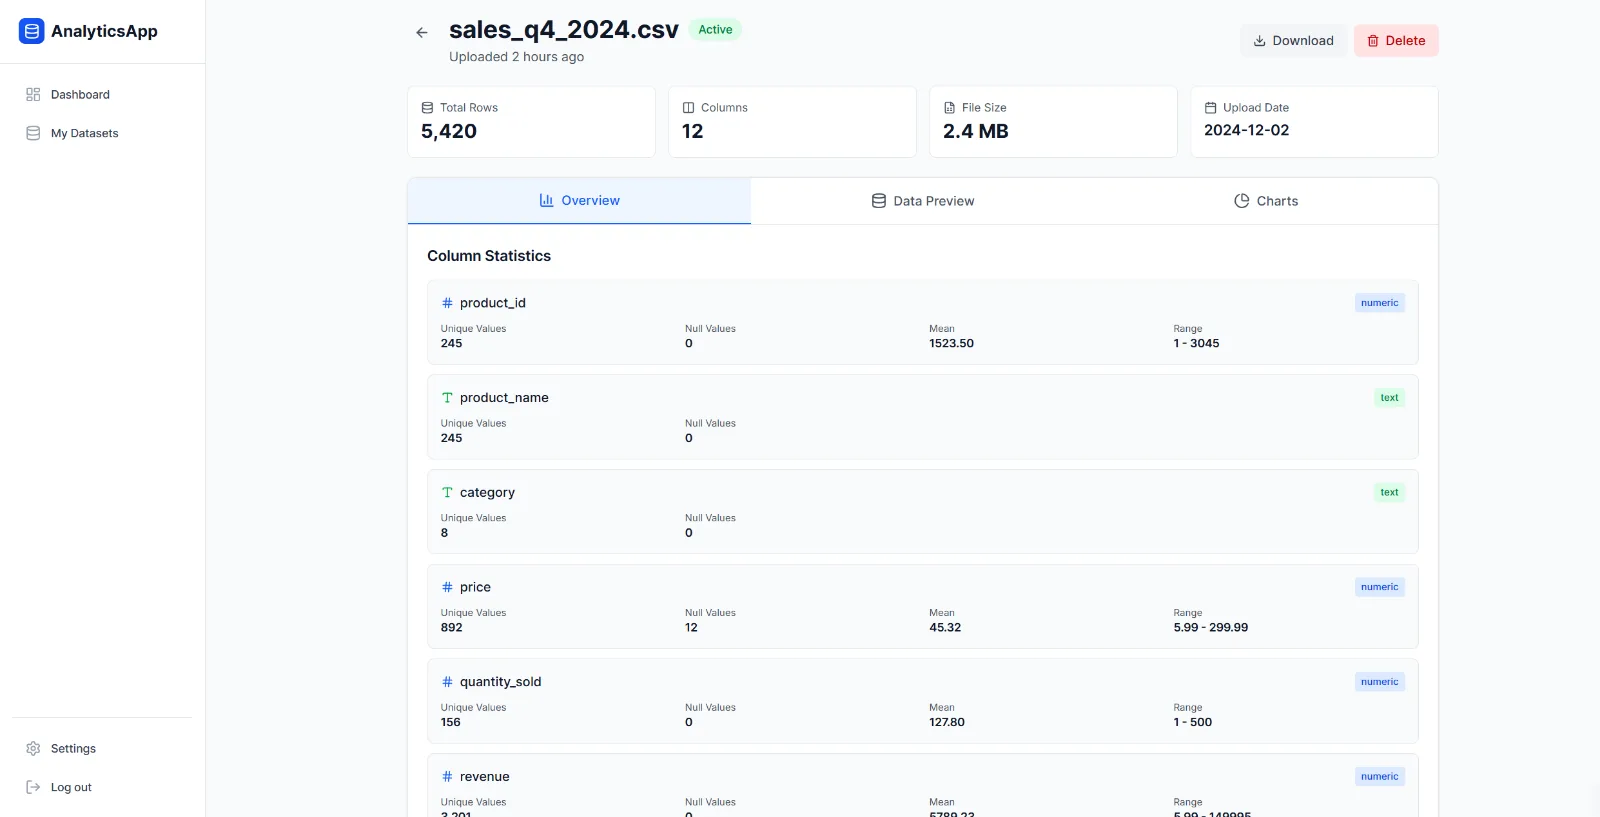
A full-stack analytics app: upload a CSV or Excel file and get column statistics and interactive charts without writing a query.
Setup sheet
How the car is built, part by part- Power unit
- Java and Spring Boot
- Bodywork
- Next.js, Tailwind CSS and Recharts
- Fuel system
- PostgreSQL for datasets, columns and charts
- Storage
- Backblaze B2 for uploaded files
- Safety
- JWT auth with OAuth2 sign-in
Car layout
Frontend appServiceML or AI modelData storeExternal- Next.js app to OAuth2 provider, sign in
- Next.js app to Spring Boot API, JWT
- Spring Boot API to PostgreSQL
- Spring Boot API to Backblaze B2
Lap breakdown
- Sector 1, Delivery and integrations
Drop a file, get answers
Upload a CSV or Excel file by drag and drop. The file goes to Backblaze B2 storage and its metadata to PostgreSQL.
- Sector 2, Data and AI
Knows your columns
The backend detects each column's data type and computes its statistics as soon as the dataset is processed.
- Sector 3, Delivery and integrations
Charts on the spot
Results show as interactive Recharts charts, and each user's dataset preferences are saved to their profile.
Onboard footage
Screenshots from the app